ETH bearish scenario post trending below the 100-day moving average
25 Apr, 2019 analyst100
Ethereum (ETH) Price Analysis – April 25
Highlights:
ETH/BTC continued to follow a bearish scenario after breaking out from a descending channel with price action trending far below the 100-day moving average. Meanwhile, ETH/USD remained in bullish territory as price action currently tests the lower channel. A bounce or break may occur.
ETH-USD Market
Key Levels:
Resistance levels: $175, $185
Support levels: $150, $140
The 100-day moving average has been acting as strong support for bearish pressure. But as it bends along with price action, this signals a heavy pressure from the bear side which is becoming reality in the market. Now, Ethereum is testing the lower channel.
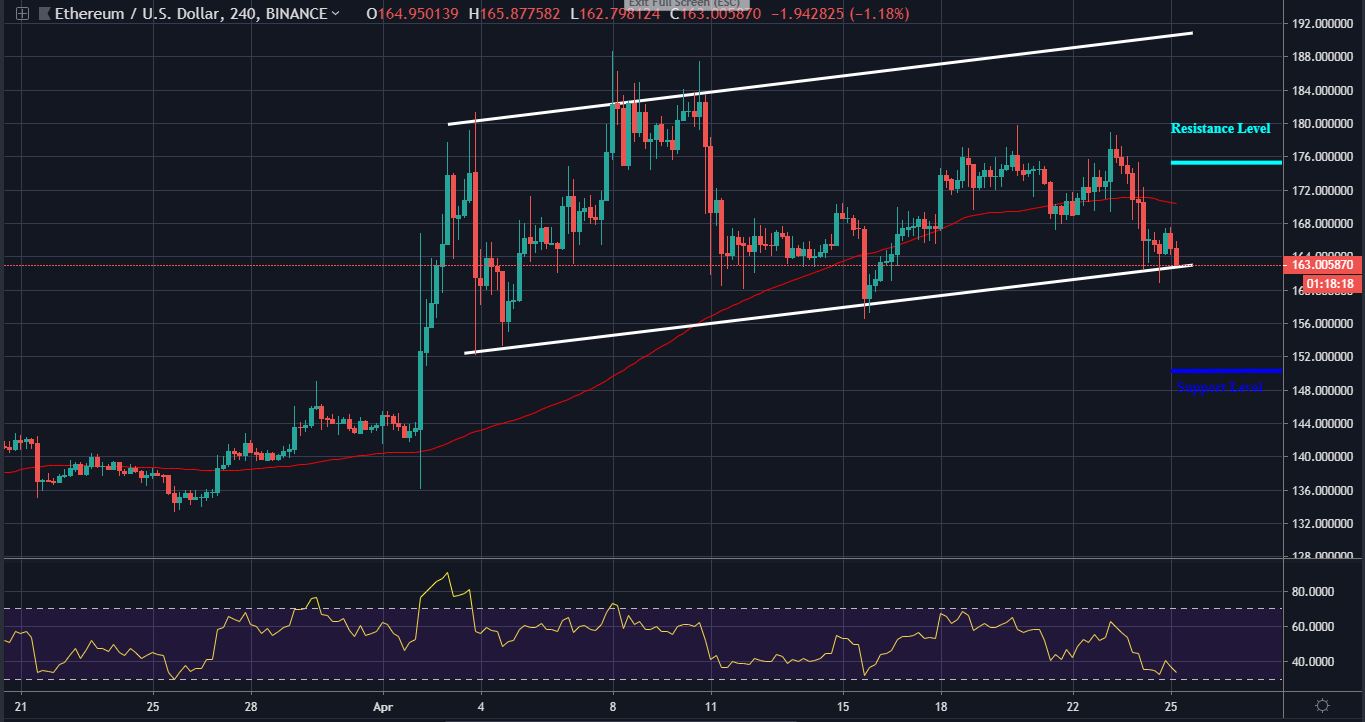
If ETH bounced up, $175 resistance would be a close level for the bulls. At the same time, a low break could slip price to a low of $150 support and possibly $140. By then, the bears may gain control of the market. As of now, ETH/USD is still following a medium-term bullish trend.
The 4-hours RSI is revealed beneath the 50 level; lying near the oversold level which has been a solid level for the token since the price action crossed the 100-day moving average. Breaching down the oversold level could lead to a bearish breakout. However, the market remains within a rising channel.
ETH-BTC Market
As appeared on the medium-term outlook, Ethereum has been on a bearish trend, for the past a month now. As a result of this, the sellers have been gaining control of the market and it appeared that the bearish scenario may continue until the selling pressure is exhausted.
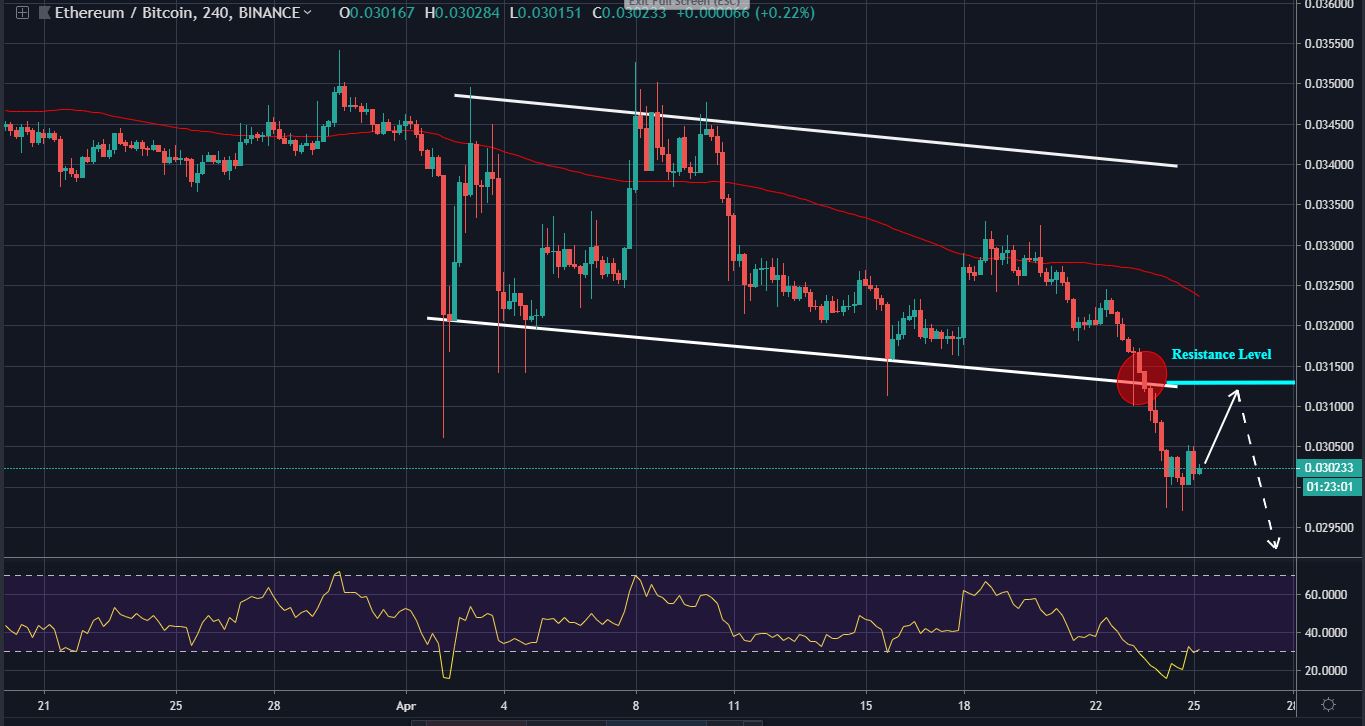
Two days ago, Ethereum broke-down from a descending channel after trading within its boundaries for three weeks, which was a signal for a strong selling momentum. In fact, the 100-day moving average is now above the price action; signaling the strength of the bears.
While on a slight consolidation, there’s a need for retest at the break point (circled red) of 0.0313BTC resistance level before riding lower. The 4-hours RSI is bearish; crossing above 50 level may initiate a buy for ETH/BTC market.
Please note: Niffler.co is not a financial advisor and this article should not be treated as financial advice. However, you are welcome to apply this information on our simulated cryptocurrency exchange.

analyst100
Azeez Mustapha is a technical analyst, has many years of trading experience in the stock, forex and the crypto markets.
Related articles
Bitcoin records 3x higher average trading volume in October than Apple, Amazon, Microsoft
After experiencing increased volatility in late September, Bitcoin (BTC) appears to be regaining its momentum towards another all-time high…
2mins 12 Oct, 2021 CryptoSlashyAlmost 5,000 new cryptocurrencies launched in the last 12 months
As the cryptocurrency industry continues to mature with mainstream adoption, investors are pumping more money into the sector contributing to the sector’s popularity.…
2mins 22 Sep, 2021 CryptoParrotEthereum adds over 38 million new addresses in 2021, 22% of all ever created
The Ethereum network plays a key role in the cryptocurrency circles, with the asset recording significant interest.…
2mins 14 Sep, 2021 CryptoParrotBlockchain-related job postings surge 118%, software development sector leads at 30%
The focus on cryptocurrency and blockchain technology has been growing in recent years as organizations explore how to leverage the industry’s full potential.…
2mins 31 Aug, 2021 CryptoParrotStart trading
Recommended crypto exchange
Buy & sell Crypto in minutes
Learn more