




Zig Zag

Early Adopter: Recognition for being an early adopter and trailblazer on Crypto Parrot

30 Trades: Successfully completed 30 trades

Bug Hunter: Saving the platform and world from bugs
@zig-zag
Joined Sep 2018
Providing: Cryptocurrency Technicals | Education and Help | Not Financial Advice |
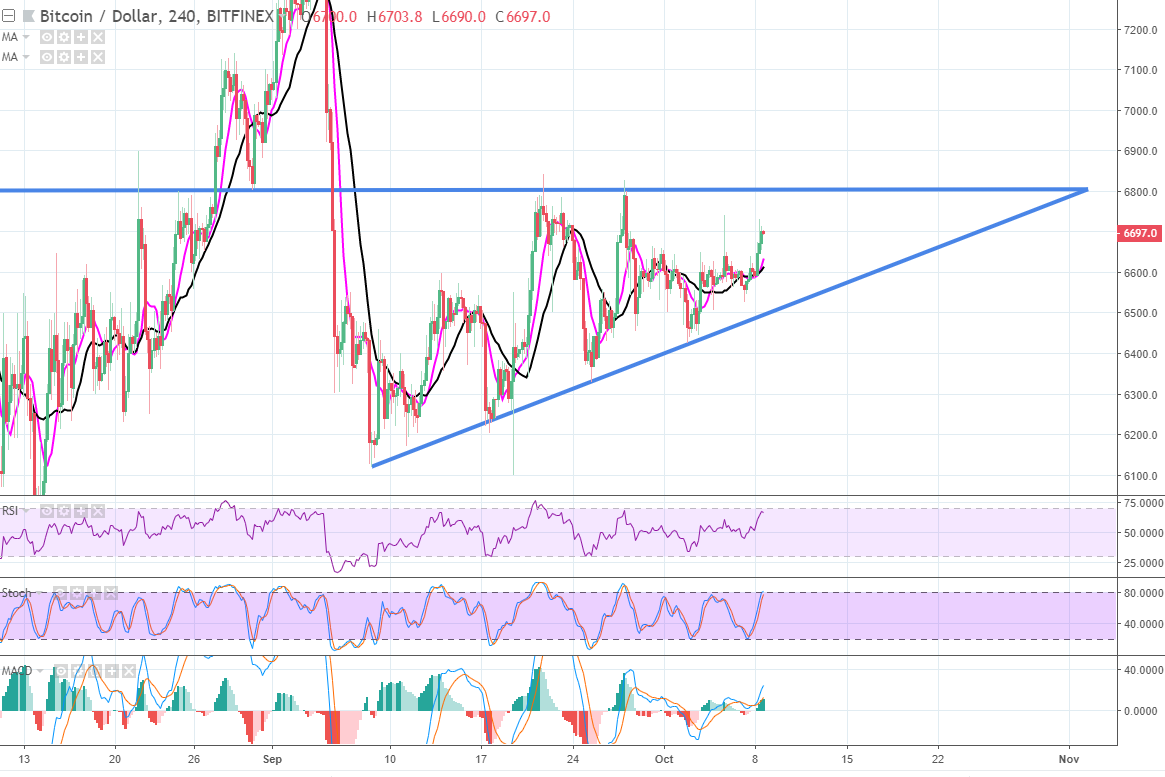
BTC Analysis: I have included 3 Oscillators in the chart above. The first is the relative Strength Index (RSI) which is a momentum based indicator. Currently the RSI is approaching the upper boundary at 70. Generally this is a signal that the market is overbought however shouldn't be solely used to identify a reversal. Stochastic is our second oscillator and this has also hit the upper boundary adding to our oversold bias. Our final Oscillator is known as the Moving Average Convergence Divergence (MACD). Unlike the two previous this is bullish as the MACD has crossed the signal line and broken clear of the zero line. Besides the indicators the price action has established a solid uptrend and is now forming an ascending triangle. Although it's tempting to short at the current level I believe there is still room for a continued rally to $6800. Its here the real decision needs to be made.
7
More from Zig Zag
Last week I was reading a lot of analysis suggesting this was the bottom for BTC. Fast forward one week, Bitcoin breaks the uptrend support at the 38.2% retracement level (3823.68) and all I hear now is that we are heading for $1500. Is this change of bias ridiculous?
The long and the short of it is yes, however I believe there are some merits to this thinking.
Many traders find it hard to change their bias as they either let emotions affect their decisions or have views which extend beyond their trading timeframe. To be a successful trader you need to be comfortable with systematically changing your bias when the INDICATORS and ANALYSIS suggest.
However the 180 degree turn from calling a bottom of a 1 year bear market to calling a new low takes fickle to a new level.
I believe the Bullish sentiment has been exaggerated by a few on the hope that the current uptick forms the platform for the bottom and I will explain why.
If you were to place 10 inexperienced traders onto a simulator my guess would be that 90% of the first trades would be a buy! Why? Because inexperienced traders lack the knowledge that you are able to sell before you buy. Secondly, Crypto has given birth to a lot of new traders and analysts. Some of which are incredibly skilled however a larger percentage have only been exposed to one asset (crypto), an asset they only started trading/investing and analysing because of their belief in its existence. In both examples a traders judgement is positively swung towards the buy side. I believe this mentality influences an analysts need to call the bottom. Think back to the highs, how many people kept trying to the call the high? Very few and those who did were the systematic thinkers amongst us not afraid to suggest crypto could fall.
There of course exceptions to my perspective above but just ask yourself, do you HODL and if so why not HODL short?
*This started out as BTC analysis and turned into a whole different beast. I hope you find my take on trading emotions interesting*

7

RonaldDrump
I must admit, this is really well said! I think that one of the reasons why people are more inclined to do long rather than short is simply that you have very fixed boundaries when shorting. It's between current price and 0. However, when you do long you there is no real upper limit, therefore long position is more appealing due to the fact is has no upside limit.
17 Jan, 2019
1
RonaldDrump * Sorry I messed up * However, when you do long there is no real upper limit, therefore long position is more appealing due to the fact is has no upside limit.
17 Jan, 2019
0
ETH update: Ethereum continues to tumble with majority of indicators pointing towards a fall to the $100 level. Oscillators (RSI and Stochastic) oversold on daily time frame however due to the volatility we can't rely on this to indicate the bounce. In the image above I have highlighted 3 volume peaks all of which have been eclipsed by this recent move. This COULD be evidence of an exhausted move. The spike lower is due to an increased number of market participants cutting losses. Spikes of this nature with exaggerated volume can indicate the end of a prevailing trend. This could simply be the unwind of the ICO rally we saw in 2017. If this is the case we will see markets hold support and consolidate. This could then be followed by an aggressive rally. Keep an eye on $100. Not Financial advice.

2
BTC update: I forgotten how many times I have now written the words RSI oversold. The "textbook" rule teaches you a market is oversold when it hits the 30 region. During highly volatile movements you should adjust this to 20 to compensate. A couple of days ago we hit a level of 9... This tells me there is a state of panic in the market. I personally use this as a signal to drop the RSI indicator and increase focus on key levels of support and resistance. In the snapshot of the market I have used different shades to indicate the support and resistance. Right now we have held above the $4000 region and ranging between support 1 and resistance 1. Before I go any further I am not going to tell you this is the bottom because truthfully nobody knows! Therefore you should prepare for a number of scenarios. 1. If we break the $4000 support we could see capitulation straight to $3000 this would be another 25% drop. There is a chance of a $3500 bounce so prepare for this should we break. 2. If we hold this region we have 3 key resistance to break with the $6100 likely to be the toughest. Depending on how the rally is initiated we could see an aggressive move that breaks all 3. Right now I am waiting for a break taking a position now is like flipping a coin. With increased uncertainty and higher volatility comes higher risk... never forget that!

4
Today's movement is a prime example of an event which many can learn from, including myself. Those who say they have nothing to learn are kidding themselves. So... How many people hit stops? How many had stops in the first place? How many over leveraged? All questions you can ask yourself when looking to better your approach. As for DGB I gave 2 scenarios the other day with the least likely playing out. The aggressive nature of the sell off has come from BTCs break of support and I believe this has dragged the whole market down. We can see we spiked through the $0.017 level I had highlighted before however with aggressive breakouts the initial move tends to over extend hence our pullback to this level. If we can close above this will continue to act as support with the $0.0157 region our last major support to the downside. Many indicators suggesting oversold so I wouldn't surprised if we bounced a little tomorrow. However such a move should be traded with caution as we are in unchartered territory for BTC in 2018.

6

DGB Analysis: Price tracking towards the current support region at $0.02019563. The region has held since August. It has been tested 3 times, the more a support is tested the weaker it will become therefore a break could see a move down to $0.017, the low from late June. This however is the less likely scenario right now given both RSI and Stochastic on the 4H chart are oversold. You will notice I have highlighted 3 resistance lines. Each has been a key level in the past. Notice how each one happens to be a round number $0.022, $0.023, and $0.024. Psychologically we naturally see round figures as "nice" prices to buy and sell. The concentrated buying and selling around these prices forms these key levels. Should we bounce from this level I would expect a fresh test of the $0.022 resistance where we could then pullback. The $0.02019563 is by no means impenetrable and for that reason any long position (buy) should be coupled with a stop just below the 0.020 line. A more aggressive stop would be to double sell the break and ride the trade south. As always this analysis is purely my opinion and not financial advice.

9
Log in or sign up to comment.